

The monitoring software for next-generation infrastructure.
Cloud-native software to supervise any Cloud.
For a 360° view of your infrastructure.

Multi-Cloud, any OS, microservices,
+200 sensors & plugins.
- All
- Big Data
- Cloud
- Microservice
- OS
- Plugin/API


Create any plugin within 1 month.
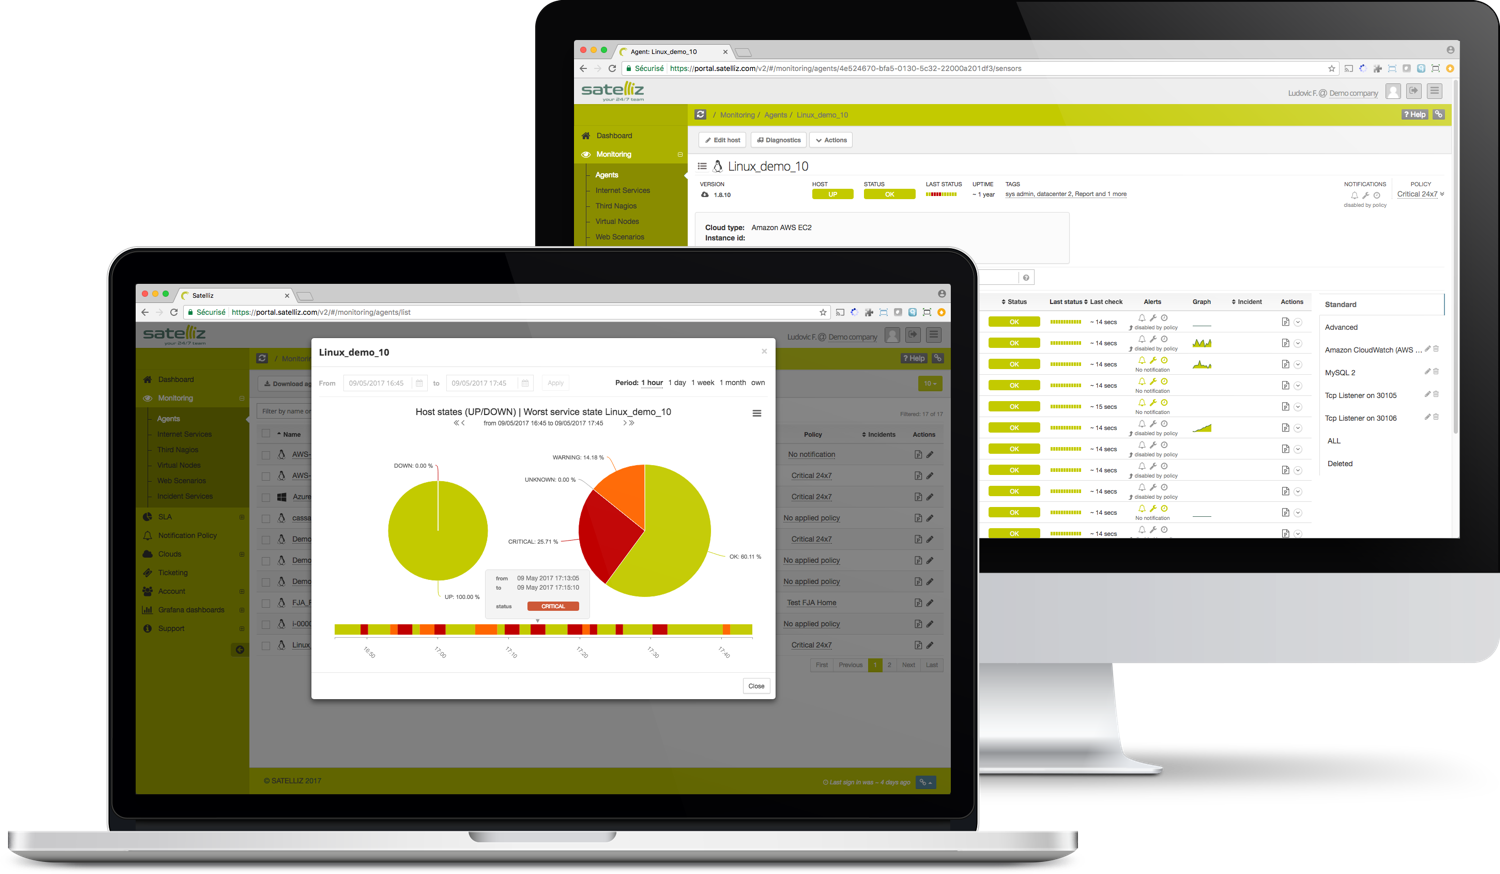
Monitor your entire infrastructure
from a single portal.
Servers, VM, containers, ...
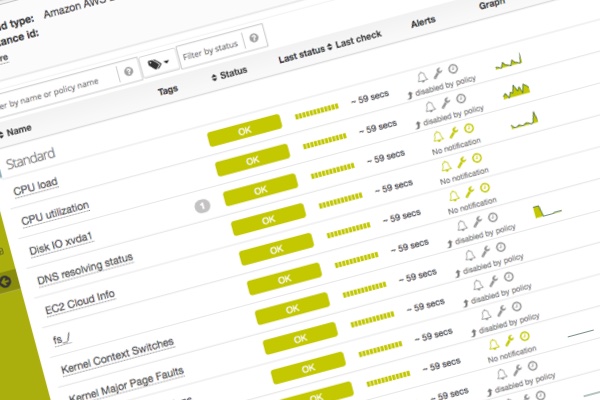
A wide variety of sensors for systems, servers and processors are available for:
1/ operating system monitoring in standard mode (RAM, CPU, discs, network interfaces, etc.)
2/ advanced performance monitoring of specific software or services (process, .exe, etc.) running on the operating system.
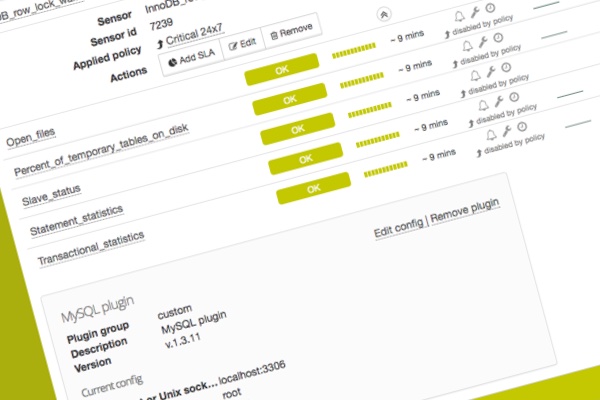
Business applications
Fine-grained monitoring of all application software levels, application engines, databases, etc.
The list of our Application Plugins, which cover the most widespread web technologies (Apache, Nginx, JBoss, Tomcat, MySQL, etc.), is constantly being expanded.
Our Custom Plugin is used to create customized sensors.
Web Services
In the QoE mode, the Web Service Sensors let you monitor web services (HTTP, HTTPS, GET/POST methods, etc.), messaging (POP3, IMAP, etc.), general networks (ICMP/TCP/UDP), specific networks (FTP, SSH, etc.), authentication systems (LDAP, Radius, etc.), etc.
The sensors can are deployed directly from the monitoring portal without requiring any adjustments on the monitored resources.
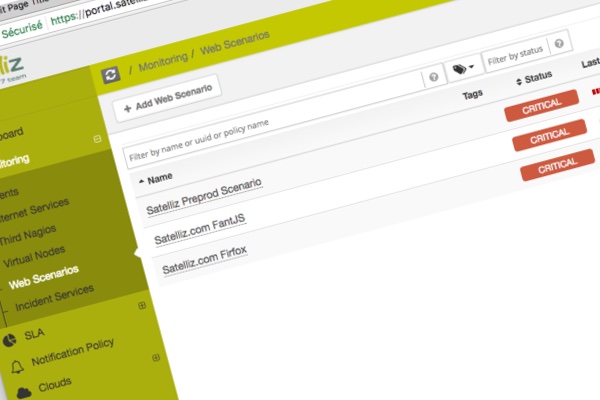
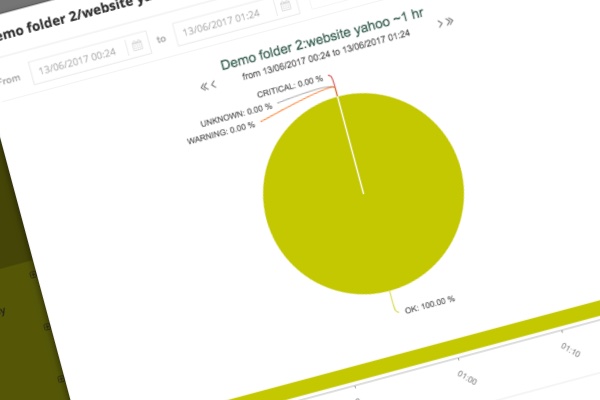
Web scenarios
In the QoE mode, complete performance monitoring of a web page sequence, such as a user going through a page script (home > product > cart > order > payment .)
The scripts are recorded using Selenium scripting language and imported into the monitoring portal. They are then run through at regular intervals to test the application browsing criteria and to detect any failures or bottlenecks between any two pages.
Lots of features for fine-grained monitoring.
Multichannel
alerts
Freely
customizable notification policies
For effective monitoring alerts, the notification policies must be fine-tuned to the main parameters: incident types, severity, time window, persons to alert, frequency of alerts, mechanism of receipt, etc.
1-minute
resolution
Precise recording for fine-grained analysis of your curves
The various monitoring sensors measure your technical data at specified time intervals. The resolution (i.e., the frequency at which such measurements are taken) is on the order of one per minute.
365-day
retention period
To preserve the precision of you real-time or delayed time curves.
The sensors record millions of metrics for a rolling 365 day period. Those are displayed on curves that maintain your specified level detail (the time curve is not smoothed out to save disk space). Your historic analyses will always remain reliable.
Automated
SLA metrics
Finally, automatic calculation of the availability rate of your services!
Our monitoring portal features an SLA module for accurate calculation of the availability rate of your services. The calculation takes maintenance periods into account, along with exclusions/inclusions and other factors, to convert your gross technical availability to net availability, which is the SLA indicator agreed to with users and clients.
... and much, much more!